
Odd-Even did clean-up the air!
So, the odd-even experiment has ended, for now. It has made a perceptible difference in the air-quality. Not just that, the commute times are shorter because of lesser congestion on roads! So even if the government has officially ended the experiment, it makes every sense for folks in Delhi to follow the odd/even rule voluntarily!
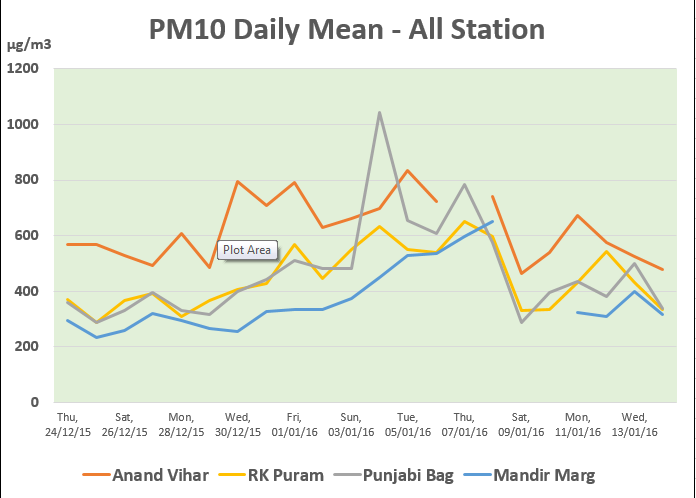
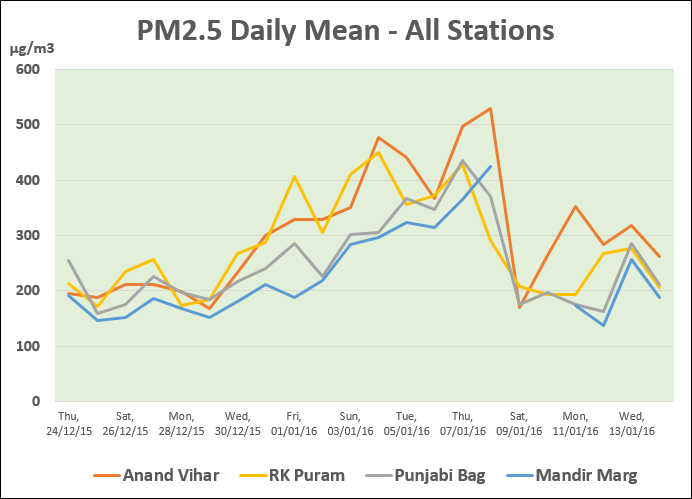
We have been monitoring pollution levels since the December-end holidays. With the odd-even driving, the pollution-level seems to be as good as that during the holidays! The improvement was more marked in second-week probably owing to better compliance. Indeed, all the areas show an improvement in PM2.5 and PM10 levels. RK Puram showed the most improvement.
What is the best time to head out?
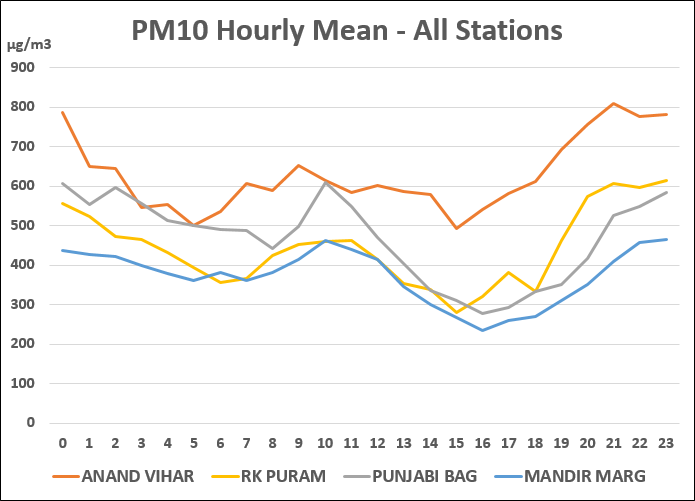
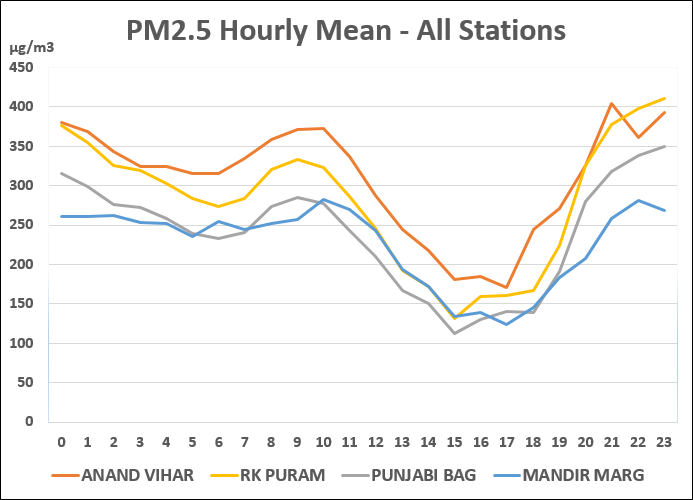
We also analyzed the pollution levels throughout the day. The late-afternoon to early-evening, i.e. 3pm to 6pm seem to be least polluted. So if you are looking to exercise in the open then early evening is your best bet! Remember, everyone needs a good dose of sunshine too!
mTatva’s Drive
Pollution in Delhi is a big concern. If you live in Delhi we know that you will give your 100% to fight the pollution-menace, and we will be tracking how the sacrifices impact the pollution-level in Delhi. We will be sending regular updates on how the pollution-figures change.
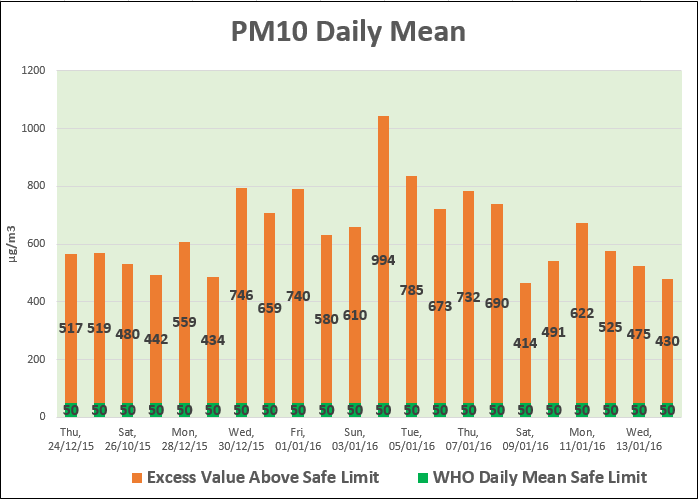
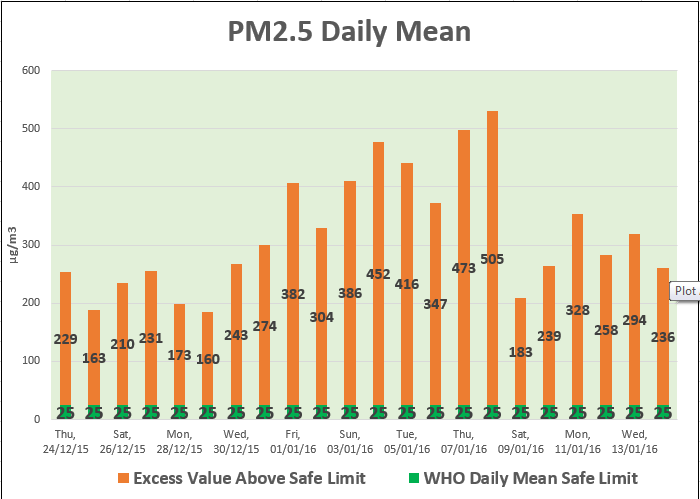
Graph below shows the evolving situation – beginning with data from before the odd-even drive. Also find some details below on what these pollutants are, their sources and impact on our health.
The graphs below are calculated by averaging the values from full day and reporting the worst value across monitored stations ion Delhi (which mostly is Anand Vihar).
 List of Pollutants:
There are many pollutants in the air which are monitored. The list recommended by WHO is:
- Particulate Matter (PM). Specifically PM10 and PM2.5
- Ozone
- Nitrogen Dioxide
- Sulphur Dioxide
What is PM10?
PM10 is particulate matter whose diameter is up to 10um which is around 10 times smaller than human hair. PM10 particles are usually smoke, dirt and dust which is generated from factories, farming, construction and roads. Once generated, they are blown away by the wind.
What is PM2.5?
PM2.5 is particulate matter whose diameter is up to 2.5um which is around 40 times smaller than human hair. These are usually toxic organic compounds and heavy metals generated from vehicles and burning of plants (farm wastes & forest fires).
Other Pollutants
Other pollutants like Ozone, Nitrogen Dioxide and Sulphur Dioxide are also monitored but are not at high levels in Delhi and hence are not studied here.
Health Hazard of PM10 and PM2.5
Both of them can lead to respiratory and cardiovascular problems leading to premature deaths in population. PM2.5 travels much deeper into lungs than PM10 and hence is more dangerous.
Exposure to particulate matter leads to increased use of medication and more visits to the doctor or emergency room. Health effects include the following:
- Coughing, wheezing, shortness of breath
- Aggravated asthma
- Lung damage (including decreased lung function and lifelong respiratory disease)
- Premature death in individuals with existing heart or lung diseases
Why Delhi?
Other metros in India like Mumbai and Kolkata also have similar levels of vehicular population, construction activities, and are densely populated areas. But the key difference is the proximity to sea. The sea-winds blow away and disperse the particulate matter in the air. Whereas in Delhi, especially during the winters, the still air traps the PM and causes problem. A rain might increase the chill, but can bring down the PM levels suddenly.
Summary
PM10 and PM2.5 are at high alarming levels, mostly due to vehicles on road and construction. The levels are more than 10 times of safe limit set by WHO. You can clearly see that during holidays, like Christmas, the PM2.5 level, which is from vehicles, comes down drastically and the air is cleaner. The levels for both PM10 and PM2.5 are much above the daily mean limit set by WHO and it is alarming. Pollution levels with odd-even driving rationing is having good impact as we can clearly see that pollution levels are coming down.
It really does impact the environment if you do not drive a vehicle on a given day. Your contribution to the environment matters, so reduce the pollutants by replacing use of private vehicles with public transport, and thus have a positive impact on environment around you.Like this:
Like Loading...
Related Articles